Using Shopify Analytics to Decode Customer Behavior and Increase Sales
Introduction to Shopify Analytics
In today’s fiercely competitive eCommerce environment, data isn’t just helpful—it's essential. Shopify analytics is a built-in tool that transforms raw data into actionable insights, enabling business owners to understand their customers better and drive more sales.
Whether you're running a small boutique or managing a high-volume online store, Shopify Analytics can reveal customer patterns, product performance, and marketing effectiveness. The secret to growing your store lies not just in what you sell, but in how well you understand who you're selling to—and Shopify Analytics is your window into that world.
Key Features of Shopify Analytics
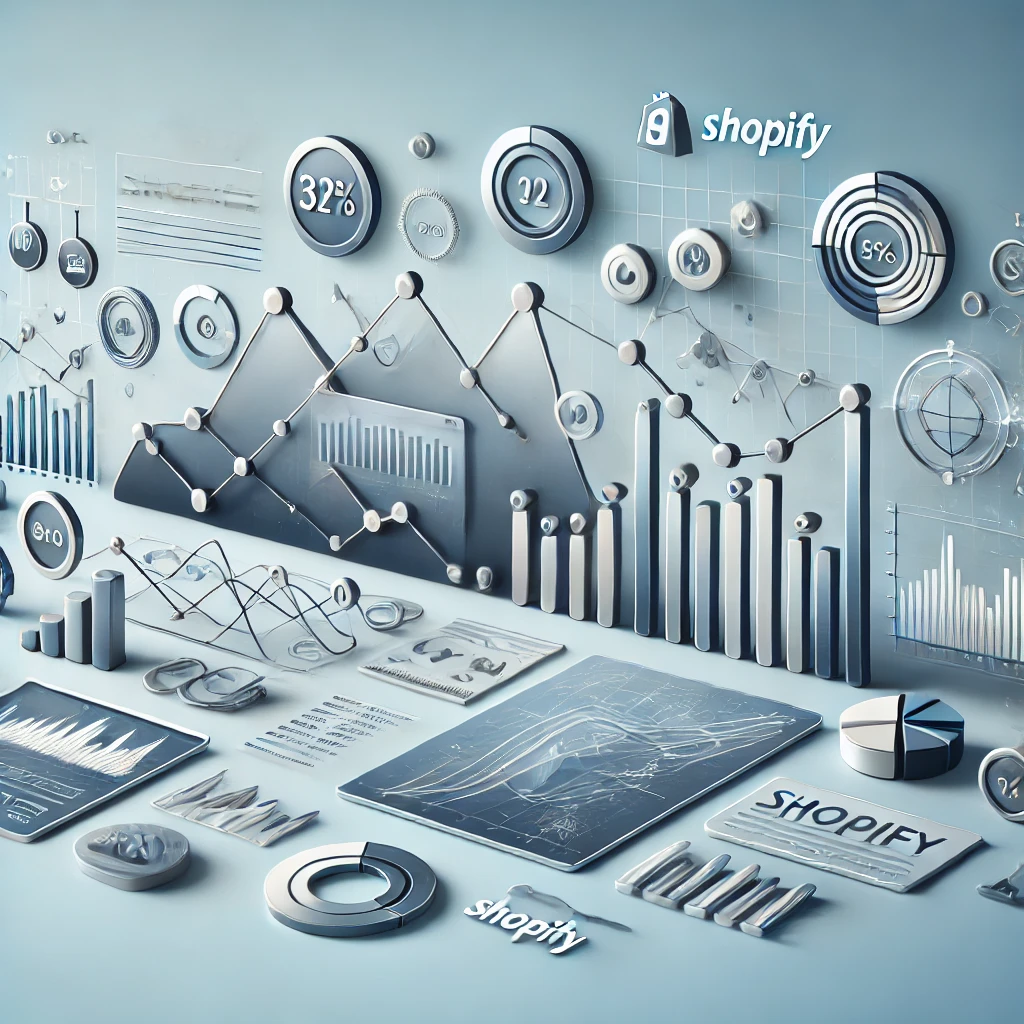
Overview of the Dashboard
The Shopify analytics dashboard gives store owners a centralized, bird’s-eye view of their store's health. It includes sales figures, visitor trends, top products, average order values, and more—all updated in real time.
Real-Time Reporting
With real-time data, you can track website visits, conversions, and even cart abandonments as they happen. This immediacy allows for quick decision-making and prompt response to emerging trends.
Mobile Accessibility
You don’t need to be at your desk to check your data. Shopify’s mobile-friendly reports ensure you can monitor your store’s performance from anywhere—perfect for entrepreneurs on the go.
Setting Up Shopify Analytics Correctly
Step-by-Step Guide
-
Log into your Shopify Admin Panel
-
Navigate to Analytics > Reports
-
Customize the dashboard by selecting the metrics that matter most to your business
-
Turn on Enhanced eCommerce tracking in Settings
Enabling Enhanced eCommerce Tracking
By integrating Shopify with Google Analytics and enabling Enhanced eCommerce, you gain access to deeper layers of customer data—like checkout behavior, product impressions, and refunds.
Understanding the Shopify Analytics Dashboard
The dashboard may seem overwhelming at first, but each metric offers critical insights:
-
Total Sales – Overall revenue including shipping and taxes
-
Sessions by Device – Desktop vs mobile engagement
-
Returning Customer Rate – Helps measure customer loyalty
-
Conversion Rate – Shows how well your store turns visitors into buyers
Navigating the dashboard effectively helps you monitor what’s working—and what isn’t.
Customer Behavior Insights from Shopify Analytics
Visitor Demographics
Learn where your customers are coming from—age, location, and even shopping times.
Device and Browser Trends
Discover how visitors are interacting with your store, whether it's through a smartphone, tablet, or desktop. Optimizing your site for top devices can boost conversions significantly.
Purchase Paths and Exit Points
Use analytics to trace the steps users take before buying—or leaving. Identify common drop-off points and optimize those pages.
Analyzing Product Performance
Your products aren't just items on a shelf—they're the heartbeat of your business.
-
Best-Selling Products: Know what your customers love the most.
-
Inventory Insights: Track which products are running low or not moving at all.
-
Revenue by Product Type: Identify which categories are most profitable.
This data helps in making smarter stock and pricing decisions.
Traffic Source Analysis
Not all visitors are created equal. Shopify analytics helps break down:
-
Direct vs Referral Traffic – Who's typing in your URL vs who's coming from another site
-
Social Media and Email Campaigns – Evaluate the ROI of your marketing efforts
By knowing your top sources, you can allocate your marketing budget more effectively.
Conversion Rate Optimization Using Analytics
Understanding your conversion rates is critical to eCommerce success. With Shopify Analytics, you can pinpoint friction points in your customer journey.
Abandoned Cart Tracking
Shopify allows you to monitor how many customers add items to their cart but leave without purchasing. Analyzing this data can help:
-
Identify common abandonment triggers
-
Optimize checkout flow
-
Launch retargeting email campaigns
Funnel Analysis
Visualize each stage of your sales funnel—from product views to checkout. If there’s a sharp drop-off at any stage, you know exactly where to focus your efforts.
Customer Retention and Repeat Purchases
One-time buyers are good. Returning customers are better. Shopify Analytics helps you track customer loyalty and repeat behavior.
Tracking Returning Customers
The Returning Customer Rate shows the percentage of buyers who come back. High numbers signal customer satisfaction and effective marketing.
Customer Lifetime Value (CLV)
This metric estimates how much revenue a customer will generate over time. Understanding CLV helps you:
-
Prioritize high-value customers
-
Design loyalty programs
-
Optimize your ad spend
Geo and Device Analytics
Knowing where and how people access your store gives you a strategic edge.
Location-Based Behavior
Track the regions with the highest conversion rates. Tailor marketing campaigns to high-performing areas or offer geo-specific discounts.
Desktop vs Mobile Conversion Patterns
If mobile traffic is high but conversions are low, your mobile UX might need improvement. Shopify Analytics can highlight such gaps instantly.
Integrating Shopify Analytics with Google Analytics
While Shopify’s built-in analytics are powerful, integrating with Google Analytics unlocks even deeper insights.
Benefits
-
Access to advanced segments and filters
-
Cross-device tracking
-
Campaign and funnel visualization
Step-by-Step Integration Guide
-
Create a Google Analytics account
-
Copy your GA4 Measurement ID
-
Paste it into Shopify under Online Store > Preferences
-
Enable Enhanced eCommerce in both platforms
With this setup, you’ll gain a 360° view of your store’s performance.
Segmenting Your Audience for Better Targeting
Not every customer is the same—and Shopify Analytics lets you group them smartly.
Using Filters and Segments
Use built-in filters to create custom views for:
-
First-time buyers
-
High spenders
-
Inactive customers
Creating Customer Profiles
These profiles help tailor email marketing, upsell strategies, and personalized product recommendations.
How to Create Custom Reports in Shopify
Custom reports let you monitor the metrics that matter most to your business goals.
Reporting Templates
Shopify offers several templates like:
-
Sales over time
-
Orders by location
-
Returns by product
KPI Dashboards
You can create a KPI dashboard with essential data points such as:
-
Conversion rate
-
AOV (Average Order Value)
-
Cart abandonment rate
These help monitor performance in real time.
Using Shopify Analytics for Marketing Decisions
Make your marketing smarter—not just louder.
Influencing Ad Spend
Track the performance of ads and adjust your budgets to focus on what brings ROI.
SEO and Content Planning
Use organic search data to determine which keywords and pages are bringing the most traffic. You can then craft blogs or landing pages around top-performing topics.
Common Mistakes to Avoid with Shopify Analytics
Even seasoned sellers can misinterpret data. Here are pitfalls to avoid:
-
Misreading Bounce Rates: A high bounce rate isn’t always bad—it depends on page intent.
-
Ignoring Micro-Conversions: Look beyond sales. Email signups, clicks, and wishlist additions also signal customer interest.
-
Not Segmenting Data: Generalized data won’t help you grow; always analyze by segment.
Case Studies: Businesses that Grew Using Shopify Analytics
Case Study 1: UrbanThreads Boutique
After using Shopify Analytics, UrbanThreads identified that 75% of their mobile traffic dropped off during checkout. A mobile-friendly redesign increased conversions by 34% in two months.
Case Study 2: GreenLeaf Naturals
By segmenting customers based on repeat purchases, GreenLeaf launched a loyalty program. Their CLV rose by 28% in the following quarter.
These real-world wins show just how impactful Shopify analytics can be when used correctly.
FAQs about Shopify Analytics
1. Is Shopify Analytics free to use?
Yes, basic reports are included with every Shopify plan. Advanced analytics and reports are available in higher-tier plans.
2. Can I use Google Analytics alongside Shopify Analytics?
Absolutely. In fact, using both provides a more complete view of your store’s performance.
3. What metrics should I focus on the most?
Start with conversion rate, average order value, and customer retention. These directly affect your bottom line.
4. How often should I check my analytics?
Daily for basic performance checks, weekly for trend analysis, and monthly for strategic reviews.
5. Can I export Shopify reports?
Yes, most reports can be exported as CSV files for further analysis.
6. What’s the difference between reports and analytics in Shopify?
Reports are detailed data summaries, while analytics provide visualizations and dashboards for quick insights.
Conclusion and Next Steps
Shopify Analytics is more than just numbers—it’s a powerful engine for growth. From understanding customer behavior to improving conversions and optimizing marketing strategies, it offers everything you need to scale smarter.
By taking full advantage of Shopify's data tools, you transform your eCommerce store into a data-driven powerhouse. If you haven’t explored its full potential yet, now’s the perfect time to start.